
Inventory Mismatch Paints a More Detailed Picture
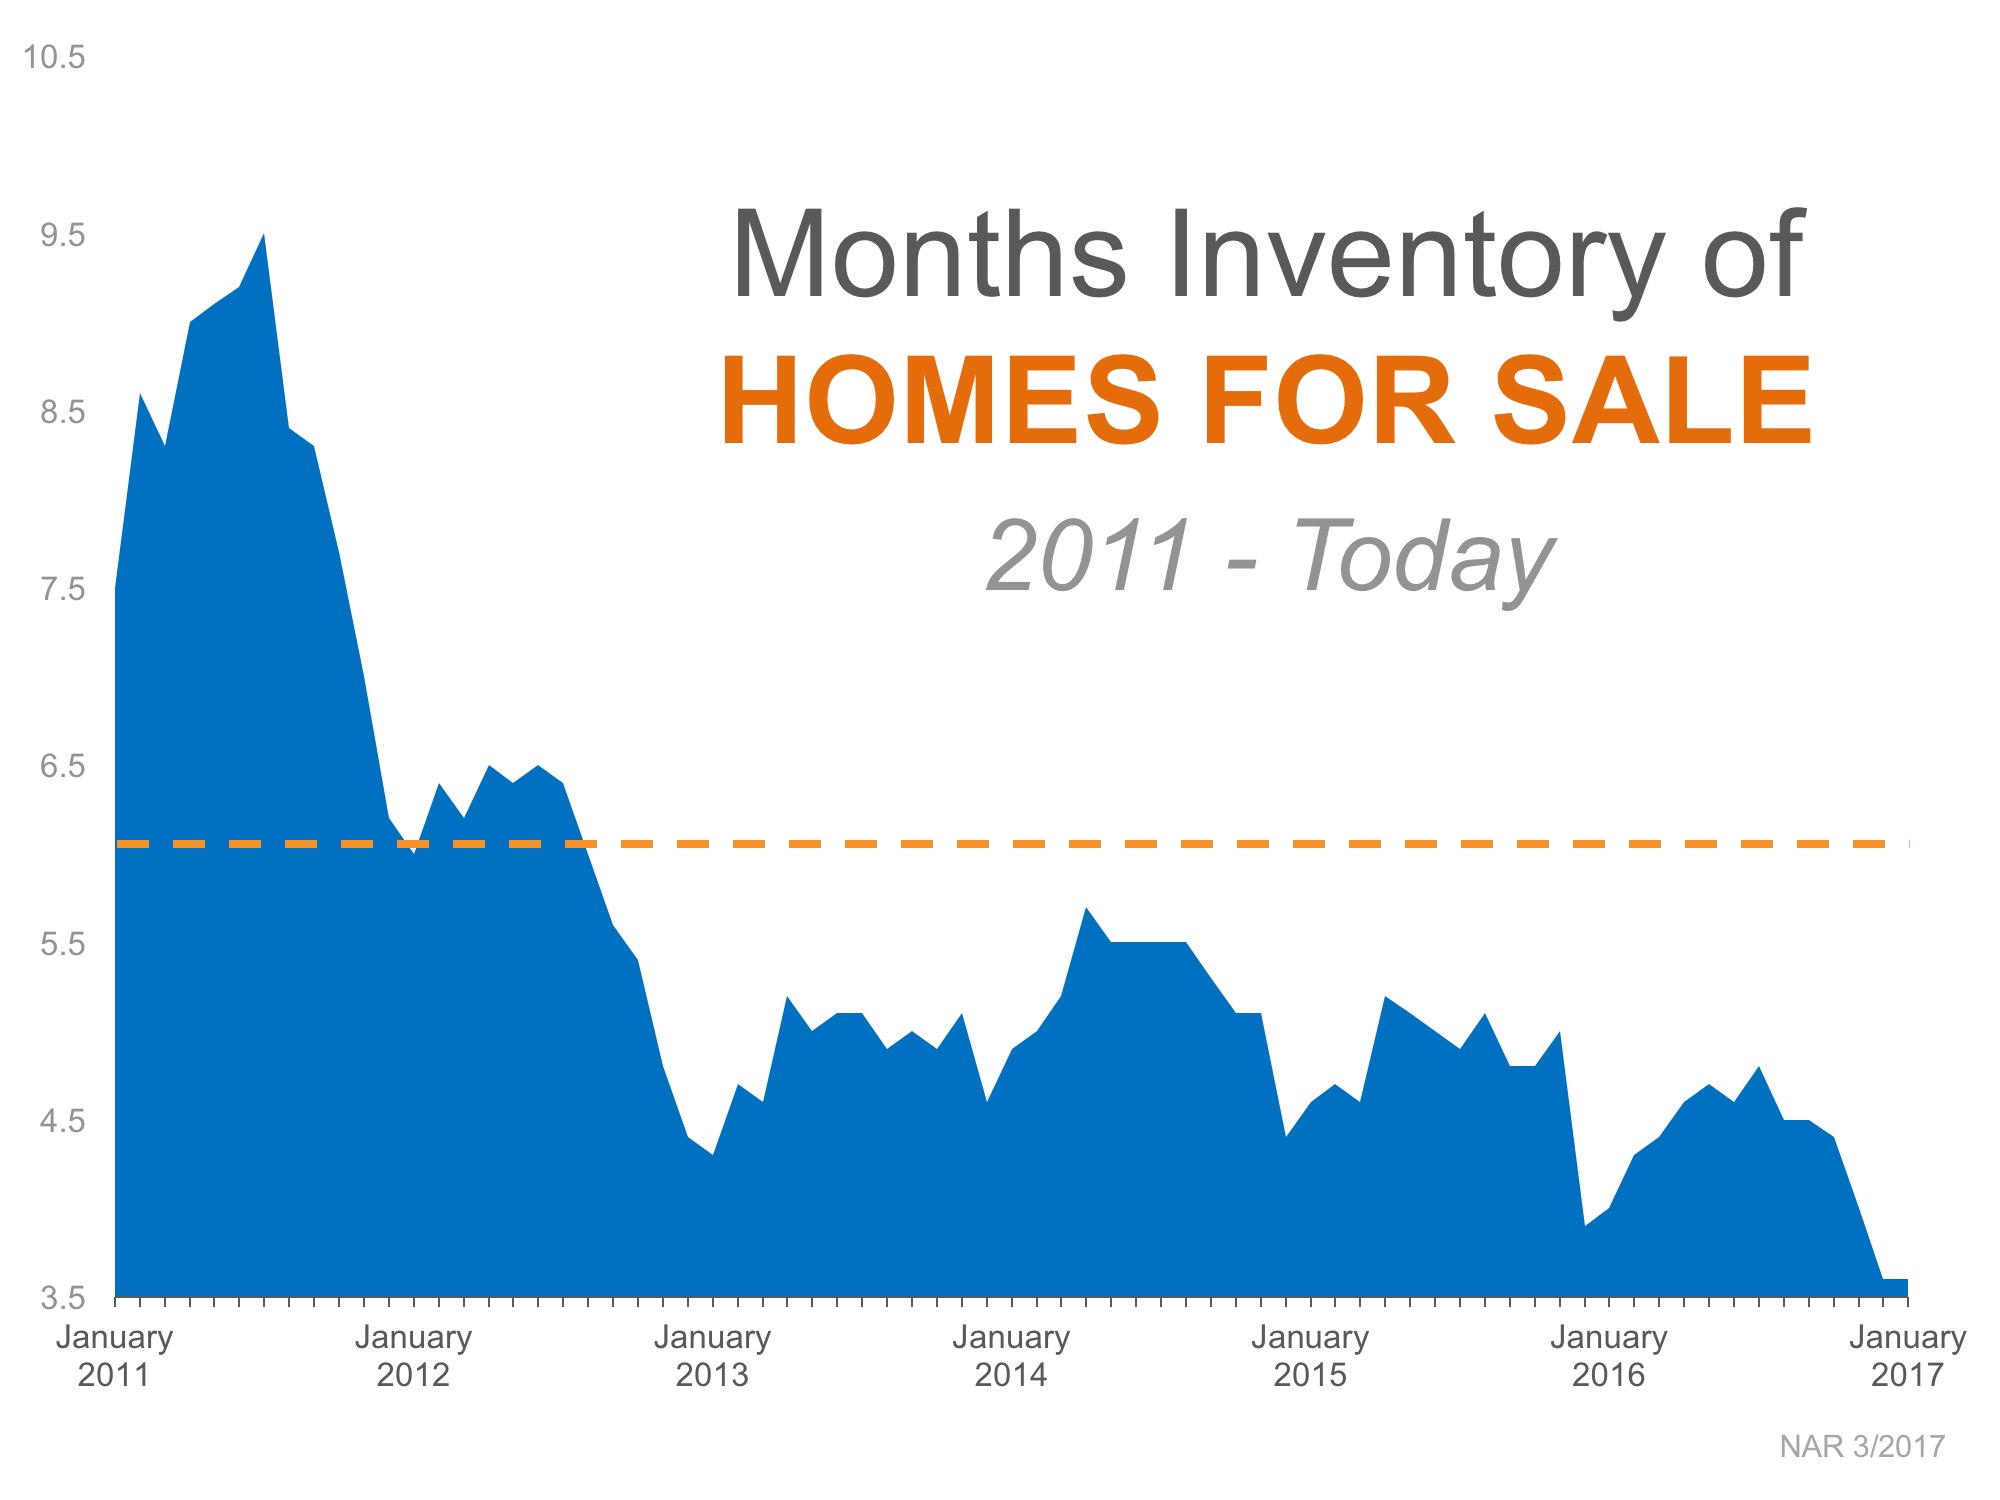
Tale of Two Markets: Inventory Mismatch Paints a More Detailed Picture. Inventory of existing homes for sale was recently reported to be at a 3.6-month supply by the National Association of Realtors latest Existing Home Sales Report. Inventory is now 7.1% lower than this time last year, marking the 20th consecutive month of year-over-year drops.
Historically, inventory must reach a 6-month supply for a normal market where home prices appreciate with inflation. Anything less than a 6-month supply is a sellers’ market, where the demand for houses outpaces supply and prices go up.
As you can see from the chart below, the United States has been in a sellers’ market since August 2012, but last month’s numbers reached a new low.
Inventory Mismatch Paints a More Detailed Picture
Recently Trulia revealed that not only is there a shortage of homes on the market in general, but the homes that are available for sale are not meeting the needs of the buyers that are searching.
Homes are generally bucketed into three groups by price range: starter, trade-up, and premium.
Trulia’s market mismatch score measures the search interest of buyers against the category of homes that are available on the market. For example: “if 60% of buyers are searching for starter homes but only 40% of listings are starter homes, [the] market mismatch score for starter homes would be 20.”
The results of their latest analysis are detailed in the chart below.
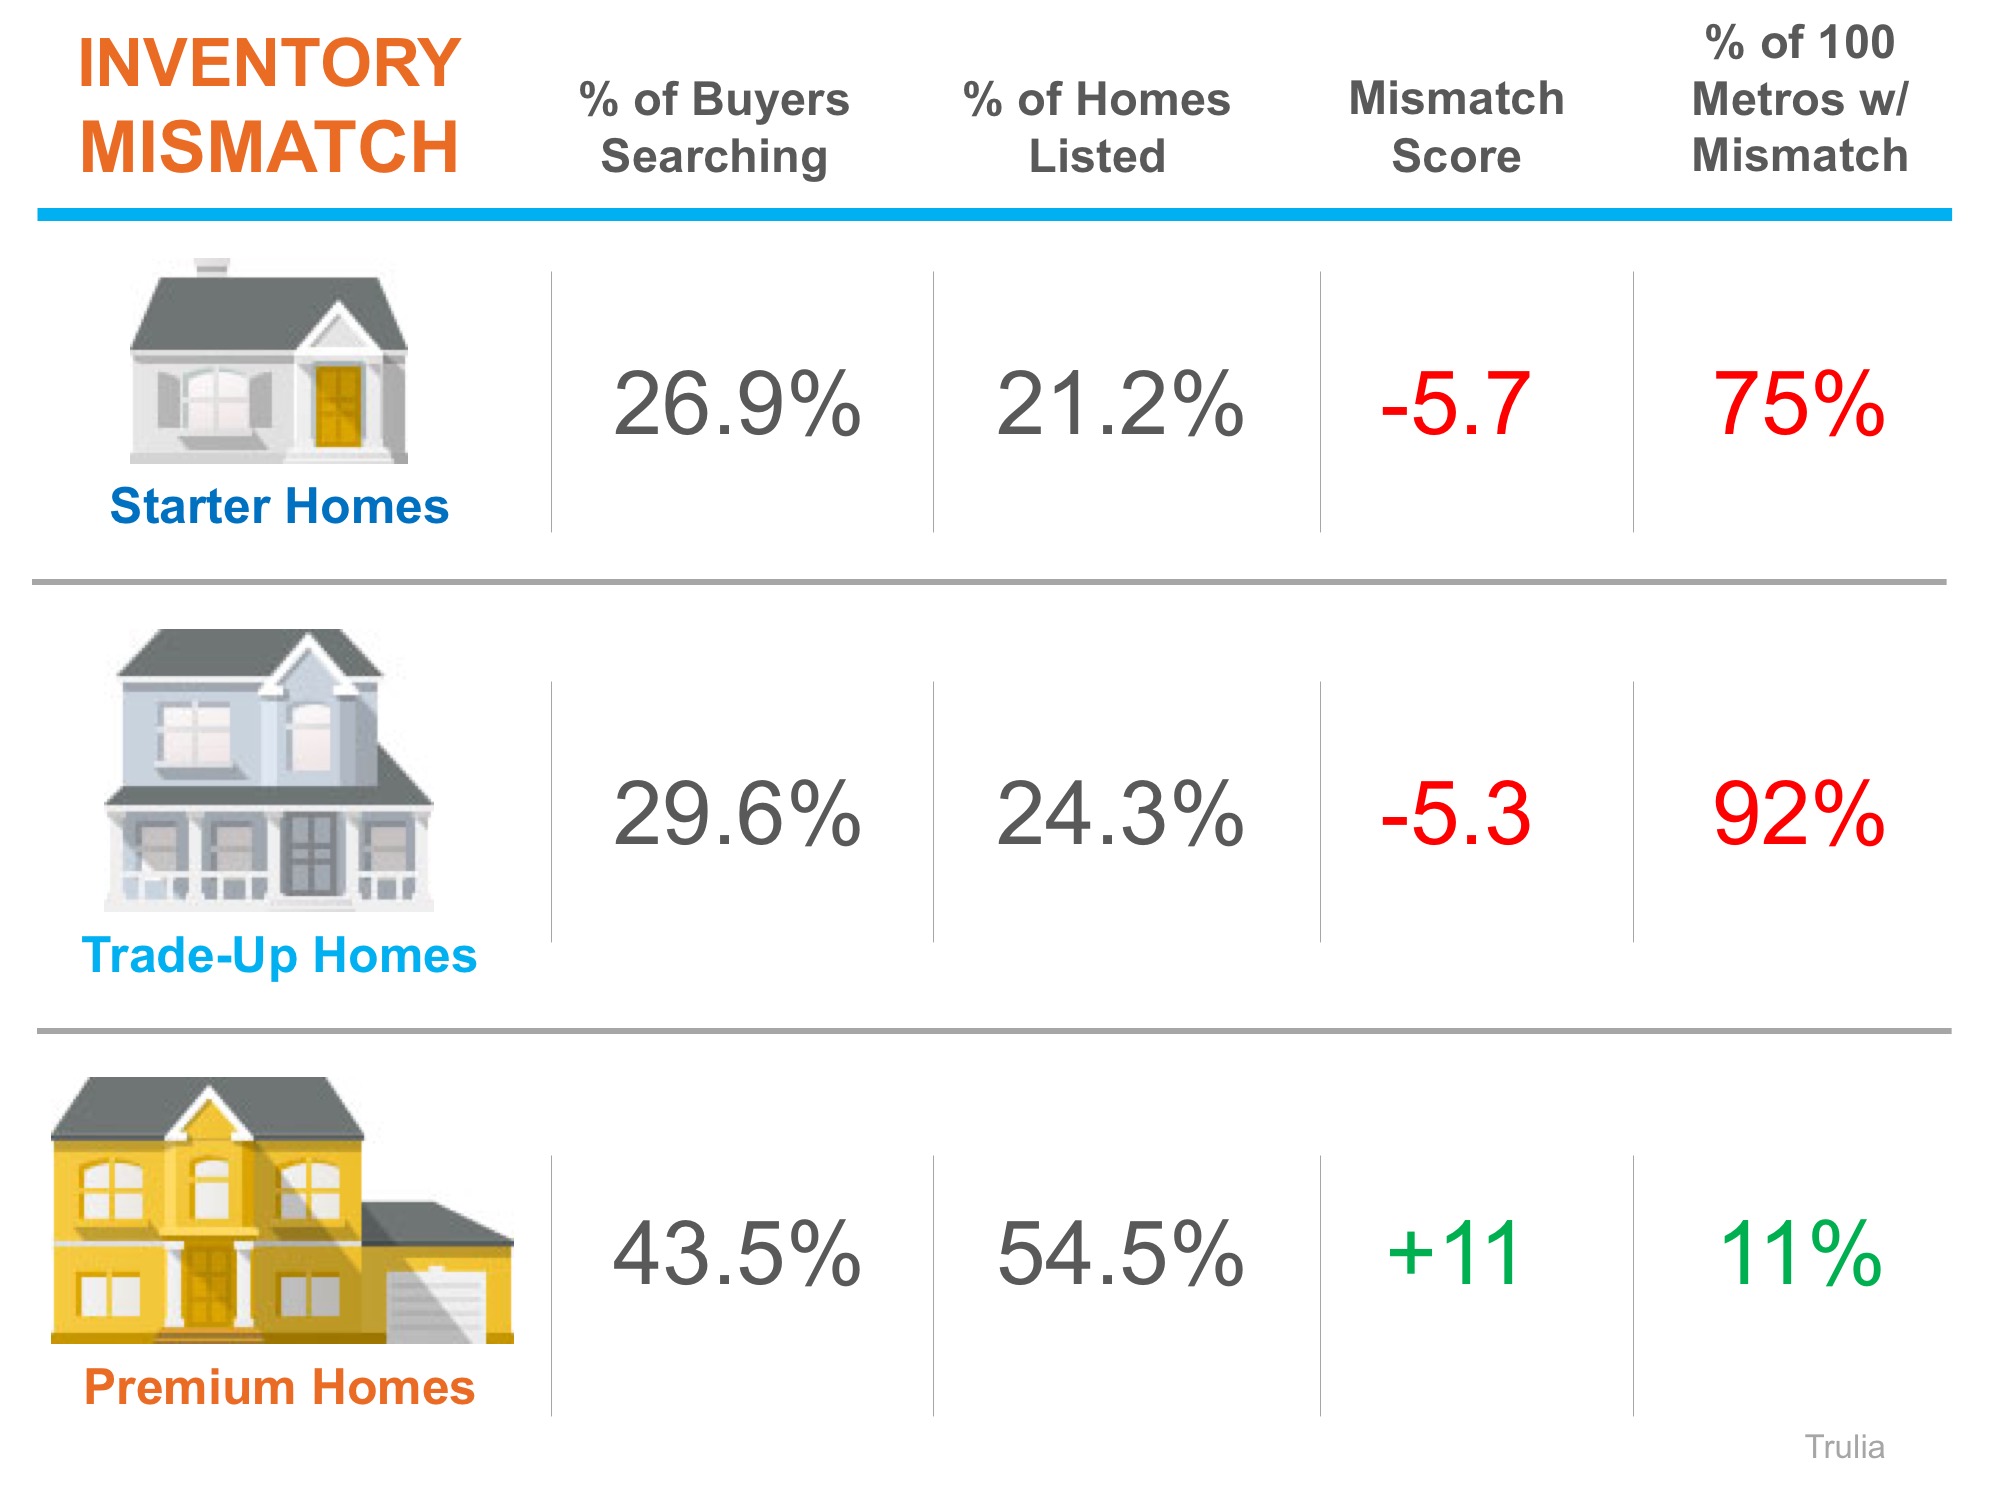
Nationally, buyers are searching for starter and trade-up homes and are coming up short with the listings available, leading to a highly competitive seller’s market in these categories. Ninety-two of the top 100 metros have a shortage in trade-up inventory.
Premium homebuyers have the best chance of less competition and a surplus of listings in their price range with an 11-point surplus, leading to more of a buyer’s market.
“It leaves Americans who are in the market for a home increasingly chasing too fewer options in lower price ranges, and sellers of premium homes more likely to be left waiting longer for a buyer.”
Lawrence Yun, NAR’s Chief Economist doesn’t see an end to this coming any time soon:
“Competition is likely to heat up even more heading into the spring for house hunters looking for homes in the lower- and mid-market price range.”
Bottom Line
Real estate is local. If you are thinking about buying OR selling this spring, let’s get together to discuss the exact market conditions in your area.

Builder Confidence Hits 11-Year High
Builder Confidence Hits 11-Year High Builder Confidence Hits 11- Year High. In many areas of the country, there are not enough homes for sale to satisfy the number of buyers looking to purchase their dream homes. Experts have long proposed that a ramp-up in new,...
Things to Consider When Selling Your Home – Winter 2017
Things to Consider When Selling Your Home. The housing crisis is finally in the rearview mirror as the real estate market moves down the road…
How Long Do Most Families Stay in Their Home?
How Long Do Most Families Stay in Their Home? The National Association of Realtors (NAR) keeps historical data on many aspects of homeownership. Findings conclude one of the data points that has changed dramatically is the median tenure of a family in a home. As the...
Over Half of All Buyers Are Surprised by Closing Costs
Over Half of All Buyers Are Surprised by Closing Costs. Keep in mind that if you are in the market for a home above this price range. your costs could be
Where Are Home Prices Heading in the Next 5 Years?
A real world view of the future of housing. Where Are Home Prices Heading in the Next 5 Years? Today, many real estate conversations center on housing prices and where they may be headed.
Existing Home Sales Reach Highest Mark Since 2007
January marked the 59th consecutive month of year-over-year price gains as the median home price rose 7.1% to $228,900.
Impact of Homeownership on Family Health vs Renters
Renters who become homeowners not only experience a significant increase in housing satisfaction but also obtain a higher satisfaction even in the same home in which they resided as renters.
Are You 1 of the 59 Million Planning to Buy This Year?
Are You 1 of the 59 Million Planning to Buy This Year? According to a survey conducted by Bankrate.com, one in four Americans are considering buying a home this year. As a result, if this statistic proves to be true, 59 million people will be looking to buy a home in...
Access: A Key Component in Getting Your House SOLD!
So, you’ve decided to sell your house. You’ve hired a real estate professional to help you with the entire process, and they have asked you what level of access you want to provide to potential buyers.
US Housing Market Is Moving into ‘Buy Territory’!
US Housing Market Moving Buy Territory. The index examines the entire US housing market and then isolates 23 major cities for comparison. The researchers “measure the relationship between purchasing property and building wealth through a buildup in equity versus renting a comparable property and investing in a portfolio of stocks and bonds.”
New Listing: 3073 Arlington Ave, Riverside – Ground Up Remodel
New Listing: 3073 Arlington Ave, Riverside – Ground Up Remodel Quiet and Serene, Remodeled in 2013. This home is simply beautiful! You're met with palms, green gardens and lush lawn. The front entry boasts an arts and craft inspired pergola protecting the entry from...
![Do You Know the Real Cost of Renting vs. Buying? [INFOGRAPHIC]](https://sp-ao.shortpixel.ai/client/to_webp,q_glossy,ret_img,w_400,h_250/https://shortsalesellit.com/wp-content/uploads/2017/02/Rent-vs.-Buy-STM-400x250.jpg)
Do You Know the Real Cost of Renting vs. Buying? [INFOGRAPHIC]
Historically, the choice between renting or buying a home has been a close decision.
Looking at the percentage of income needed to rent a median-priced home today (30%), vs. the percentage needed to buy a median-priced home (15%), the choice becomes obvious.
Every market is different. Before you renew your lease again, find out if you could use your housing costs to own a home of your own!

The Impact of Homeownership on Civic Involvement
Homeowners have a much greater financial stake in their neighborhoods than renters. With the median national home price in 2015 at $223,900, even a 5% decline in home values will translate into a loss of more than $11,195 for a typical homeowner.

January 2017 Home Sales Report Riverside 92506
Real estate sales for zip code 92506, Riverside California were solid for January 2017. The biggest change is the number of homes listed for January 2017. That number increased 13.6% from 51 homes in January 2016 to 59 homes in January 2017

8 Tips To Downsize Your Parents Home – Boomers
This is an Ikea and Target generation. They live minimally, much more so than the boomers. As a result, they don’t have the emotional connection to things that earlier generations did.
Upland 91784 January 2017 Homes Sales Report
Rolling into 2017 has been much of the same as 2016. Home sales price are on a rise year over year and the number of home listings are down considerably.

92506 Real Estate Sales Year In Review Canyon Crest California
It’s that time of year when we review the 2016 real estate market in Riverside Canyon Crest California, specifically the 92506 zip code. We look at all factors. From average sold price, average days on market to the number of homes listed and as a result, we’re looking at a good 2017. Home prices are up and inventory is down consequently we’ll likely see an increase in home prices.

91784 A Real Estate Sales Year In Review for Upland California
It’s that time of year when we review the 2016 real estate market in Upland California, specifically the 91784 zip code. We look at all factors. From average sold price, average days on market to the number of homes listed and as a result, we’re looking at a good 2017. Home prices are up and inventory is down consequently we’ll likely see an increase in home prices.