
Charts Don’t Lie About Housing Affordability
These Charts Don’t Lie About Housing Affordability! There’s a lot of discussion about the current state of housing affordability for both first-time and move-up buyers. Much of the narrative is tarnished with a negative slant. However, the truth is that housing affordability is better today than at almost any time in our history.
The naysayers are correct that affordability today is not as good as it has been over the last several years. But, we must remember that home prices collapsed during the housing crash, and distressed properties (foreclosures and short sales) kept home values depressed for years. When we compare affordability to the decades that proceeded the crash, a different story is revealed.
Here is a graph of the National Association of Realtors’ Housing Affordability Index. The higher the graph, the more affordable homes are. 
Charts Don’t Lie About Housing Affordability
We can see that affordability is better today than in the fifteen years prior to the boom and bust. CoreLogic just published a report showing the National Homebuyers’ “Typical Mortgage Payment.” Here is a graph of their findings: 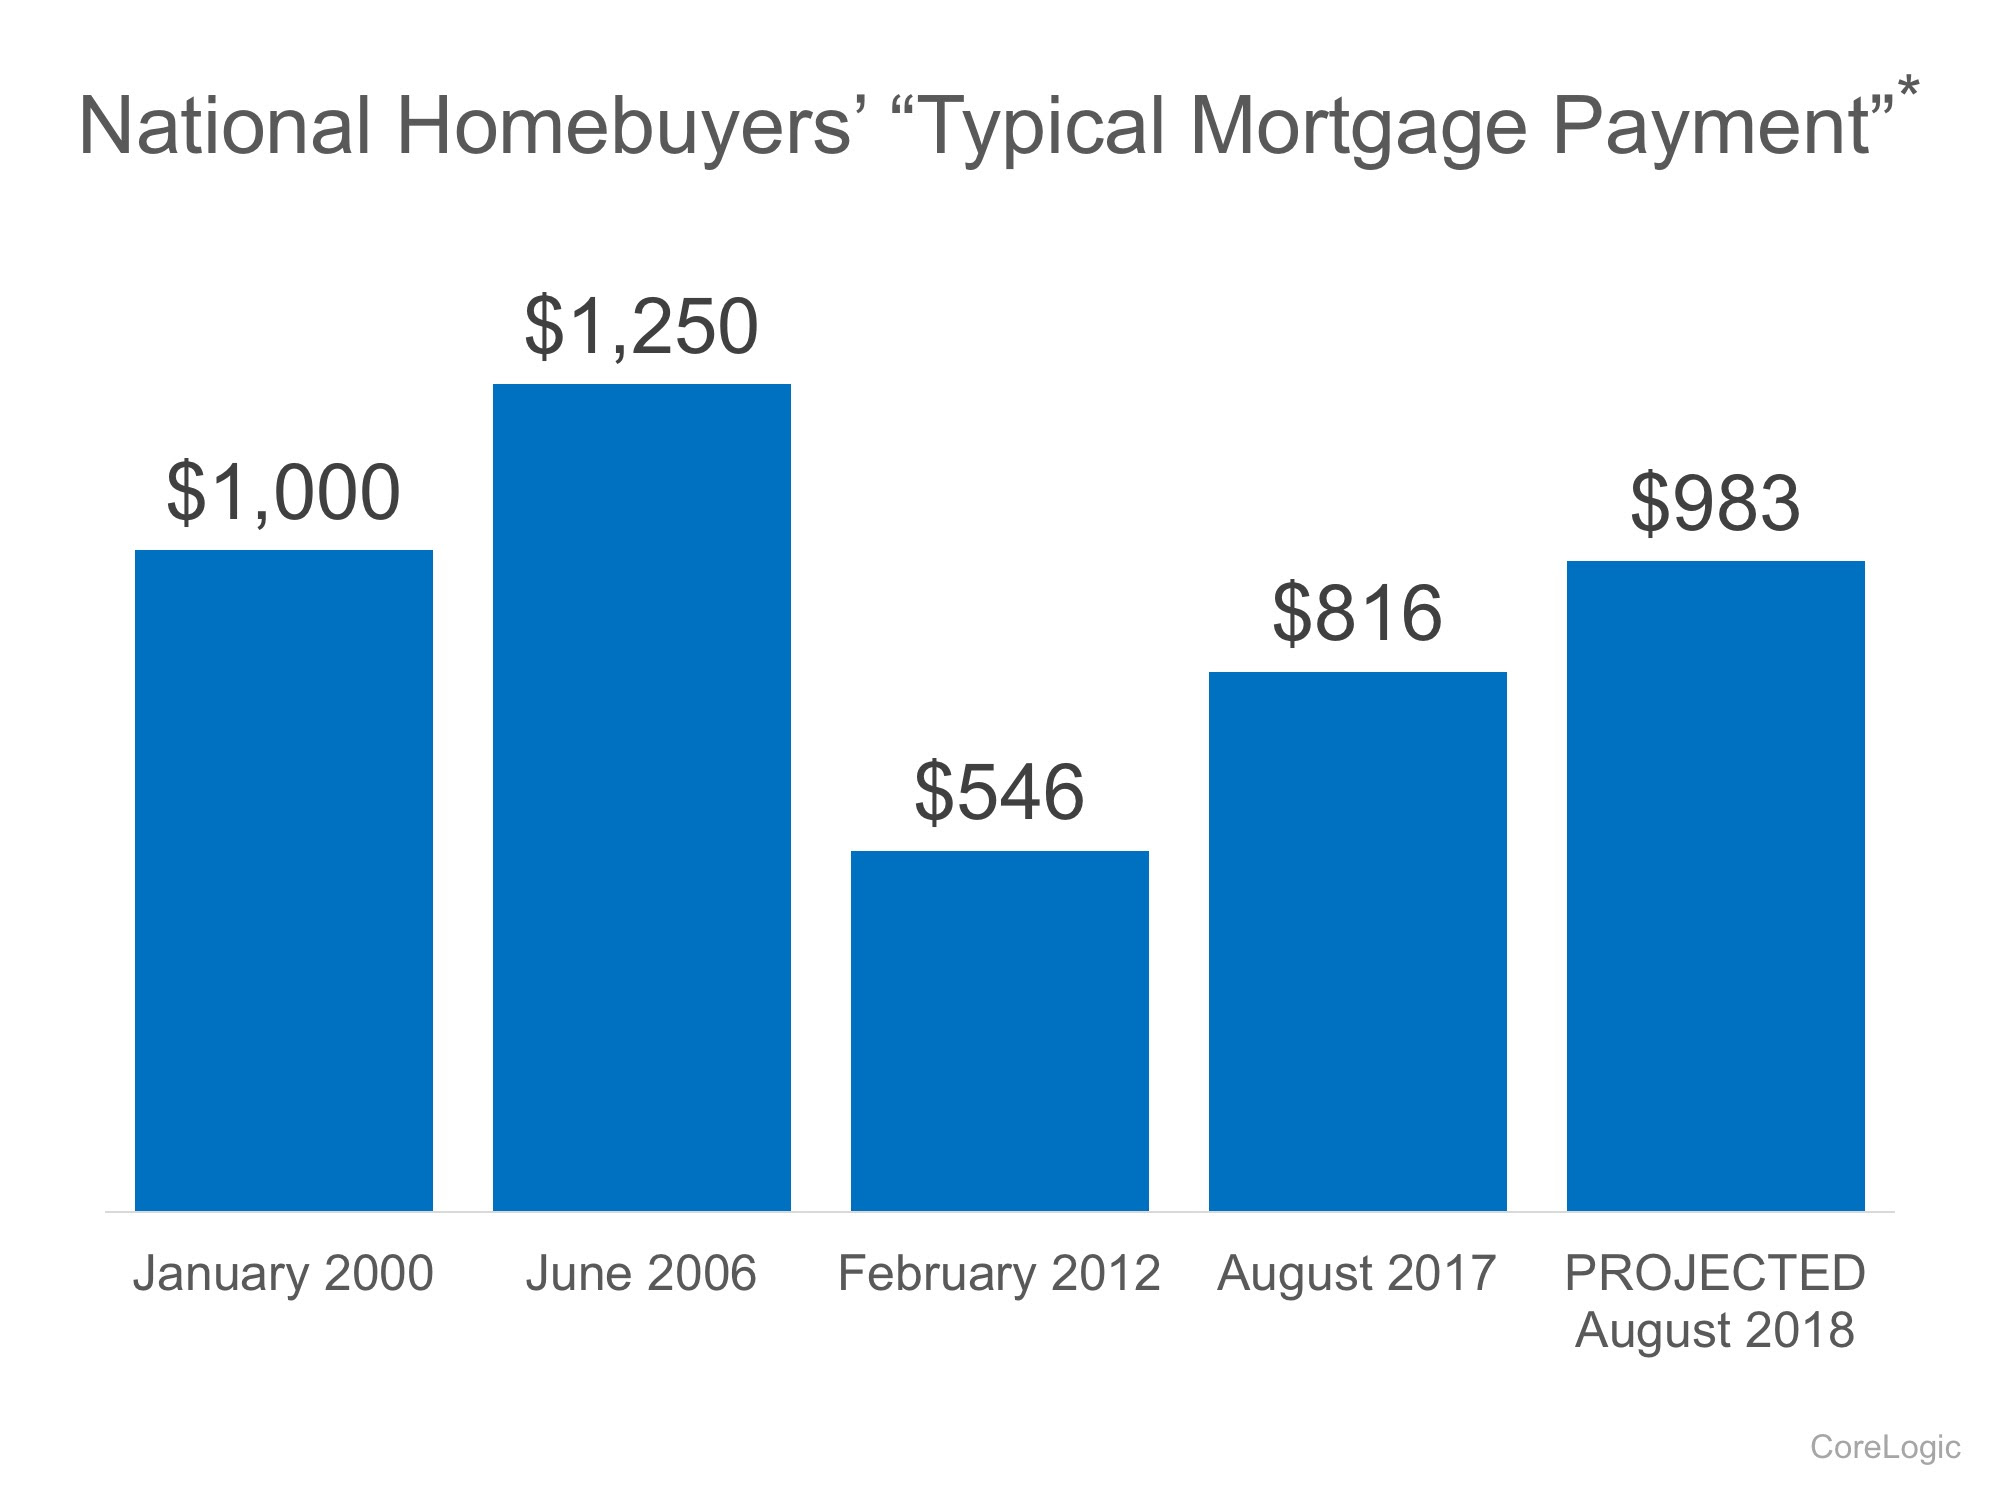 It reveals that, though a ‘typical’ housing payment was less expensive in 2012 (remember distressed properties), it is currently less expensive than it was in 2000 and is still projected to be lower next year than it was in 2000.
Bottom Line
Mark Fleming, Chief Economist at First American, explained it best:
“While borrowing power for the potential home buyer has fallen relative to the low point of 2012, it remains high today and will remain high next year, relative to the long run average. If you don’t want to rent anymore and are considering becoming a homeowner, even if mortgage rates rise next year, your borrowing power will remain strong by historic standards.”
Call Us Now To Sell Your Home…
Office: 909.985.9392 or Text Us: 714.657.6634

Builder Confidence Hits 11-Year High
Builder Confidence Hits 11-Year High Builder Confidence Hits 11- Year High. In many areas of the country, there are not enough homes for sale to satisfy the number of buyers looking to purchase their dream homes. Experts have long proposed that a ramp-up in new,...
Things to Consider When Selling Your Home – Winter 2017
Things to Consider When Selling Your Home. The housing crisis is finally in the rearview mirror as the real estate market moves down the road…
How Long Do Most Families Stay in Their Home?
How Long Do Most Families Stay in Their Home? The National Association of Realtors (NAR) keeps historical data on many aspects of homeownership. Findings conclude one of the data points that has changed dramatically is the median tenure of a family in a home. As the...
Over Half of All Buyers Are Surprised by Closing Costs
Over Half of All Buyers Are Surprised by Closing Costs. Keep in mind that if you are in the market for a home above this price range. your costs could be
Where Are Home Prices Heading in the Next 5 Years?
A real world view of the future of housing. Where Are Home Prices Heading in the Next 5 Years? Today, many real estate conversations center on housing prices and where they may be headed.
Existing Home Sales Reach Highest Mark Since 2007
January marked the 59th consecutive month of year-over-year price gains as the median home price rose 7.1% to $228,900.
Impact of Homeownership on Family Health vs Renters
Renters who become homeowners not only experience a significant increase in housing satisfaction but also obtain a higher satisfaction even in the same home in which they resided as renters.
Are You 1 of the 59 Million Planning to Buy This Year?
Are You 1 of the 59 Million Planning to Buy This Year? According to a survey conducted by Bankrate.com, one in four Americans are considering buying a home this year. As a result, if this statistic proves to be true, 59 million people will be looking to buy a home in...
Access: A Key Component in Getting Your House SOLD!
So, you’ve decided to sell your house. You’ve hired a real estate professional to help you with the entire process, and they have asked you what level of access you want to provide to potential buyers.
US Housing Market Is Moving into ‘Buy Territory’!
US Housing Market Moving Buy Territory. The index examines the entire US housing market and then isolates 23 major cities for comparison. The researchers “measure the relationship between purchasing property and building wealth through a buildup in equity versus renting a comparable property and investing in a portfolio of stocks and bonds.”
New Listing: 3073 Arlington Ave, Riverside – Ground Up Remodel
New Listing: 3073 Arlington Ave, Riverside – Ground Up Remodel Quiet and Serene, Remodeled in 2013. This home is simply beautiful! You're met with palms, green gardens and lush lawn. The front entry boasts an arts and craft inspired pergola protecting the entry from...
![Do You Know the Real Cost of Renting vs. Buying? [INFOGRAPHIC]](https://sp-ao.shortpixel.ai/client/to_webp,q_glossy,ret_img,w_400,h_250/https://shortsalesellit.com/wp-content/uploads/2017/02/Rent-vs.-Buy-STM-400x250.jpg)
Do You Know the Real Cost of Renting vs. Buying? [INFOGRAPHIC]
Historically, the choice between renting or buying a home has been a close decision.
Looking at the percentage of income needed to rent a median-priced home today (30%), vs. the percentage needed to buy a median-priced home (15%), the choice becomes obvious.
Every market is different. Before you renew your lease again, find out if you could use your housing costs to own a home of your own!

The Impact of Homeownership on Civic Involvement
Homeowners have a much greater financial stake in their neighborhoods than renters. With the median national home price in 2015 at $223,900, even a 5% decline in home values will translate into a loss of more than $11,195 for a typical homeowner.

January 2017 Home Sales Report Riverside 92506
Real estate sales for zip code 92506, Riverside California were solid for January 2017. The biggest change is the number of homes listed for January 2017. That number increased 13.6% from 51 homes in January 2016 to 59 homes in January 2017

8 Tips To Downsize Your Parents Home – Boomers
This is an Ikea and Target generation. They live minimally, much more so than the boomers. As a result, they don’t have the emotional connection to things that earlier generations did.
Upland 91784 January 2017 Homes Sales Report
Rolling into 2017 has been much of the same as 2016. Home sales price are on a rise year over year and the number of home listings are down considerably.

92506 Real Estate Sales Year In Review Canyon Crest California
It’s that time of year when we review the 2016 real estate market in Riverside Canyon Crest California, specifically the 92506 zip code. We look at all factors. From average sold price, average days on market to the number of homes listed and as a result, we’re looking at a good 2017. Home prices are up and inventory is down consequently we’ll likely see an increase in home prices.

91784 A Real Estate Sales Year In Review for Upland California
It’s that time of year when we review the 2016 real estate market in Upland California, specifically the 91784 zip code. We look at all factors. From average sold price, average days on market to the number of homes listed and as a result, we’re looking at a good 2017. Home prices are up and inventory is down consequently we’ll likely see an increase in home prices.